E-commerce · Fashion · Mobile + Web

Aanchal — ethnic wear, sized to you

A premium ethnic wear shopping app that celebrates tradition with modern convenience. This case study walks the full design process in ten stages, from the problem statement to a clickable prototype, a usability test kit and an iteration from v1 to v2.

Role: UX researcher & UI designerPlatform: mobile app + web Type: self-directed conceptTools: Figma
Open the clickable prototype Download Figma plugin (builds the native file)
01 Problem02 Users03 IA04 Flows05 Wireframes 06 High-fidelity07 Prototype08 Testing09 Iteration10 Outcome
Aanchal brand banner with a geometric rosette pattern

About this case study

Aanchal is a concept project. Personas and the empathy map are research-based hypotheses, not interview data. The heuristic evaluation is an expert review, not user data. The usability test is planned, not yet run, so no test results or outcome metrics are claimed. Market figures come from published reports cited in the project research and are labelled as estimates or projections. Illustrations are original drawings; sample prices and dates are illustrative.

01 — Problem statement

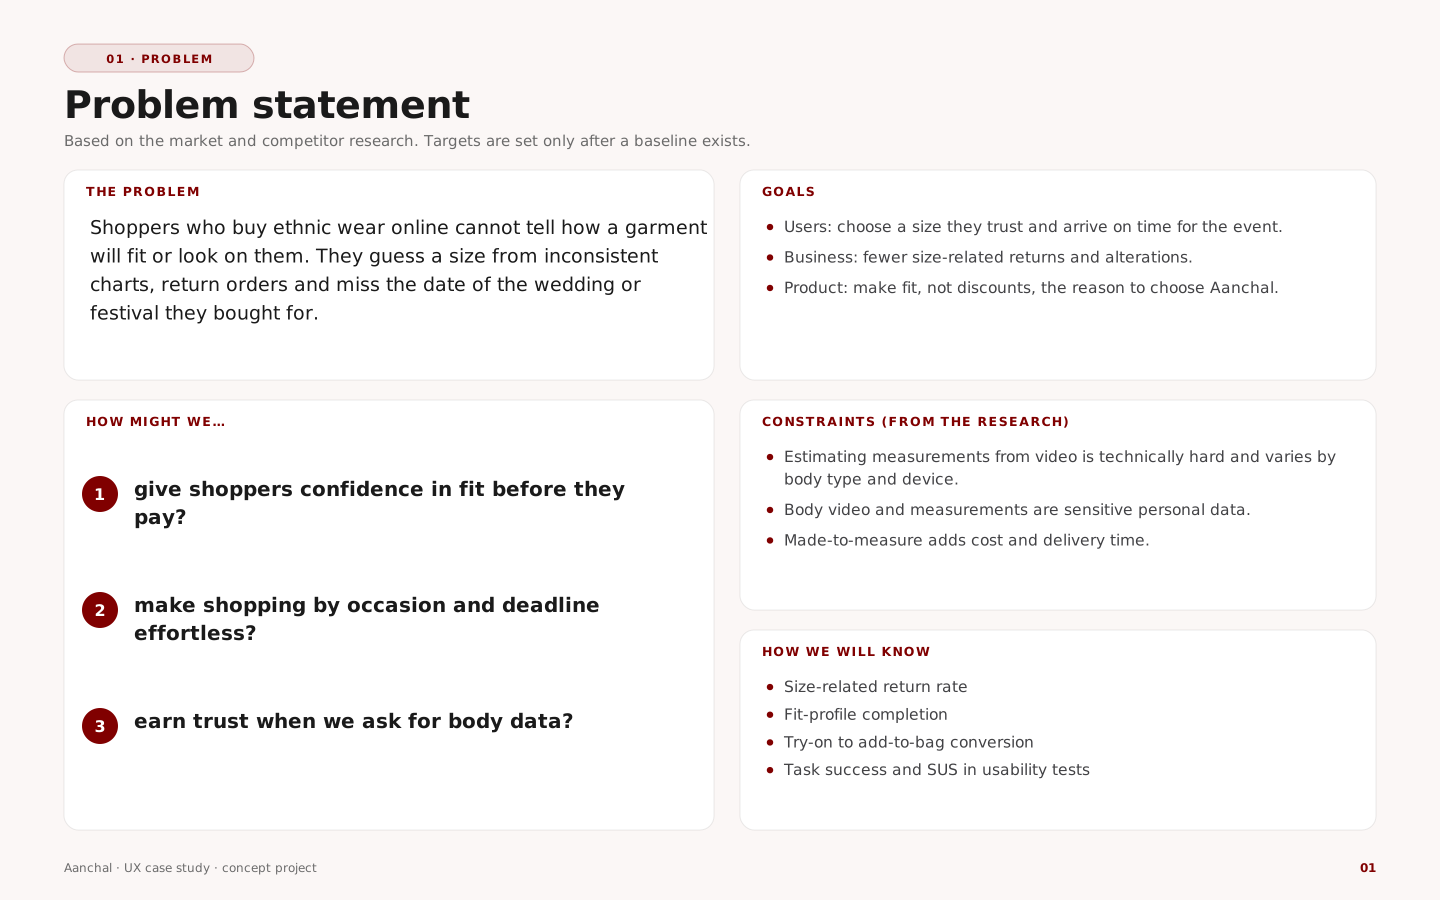
Shoppers cannot tell how ethnic wear will fit before they pay

Ethnic wear is bought for weddings, festivals and daily use, in India and across the diaspora. Online, shoppers guess a size from inconsistent charts, return orders and sometimes miss the event they bought for.

Obstacles to buying online

No personalisation
Clothes do not fit
Sizes do not match across brands

For shoppers

Fit problems lead to returns
Cannot inspect the garment
NRI buyers struggle most with sizing

For brands

High return rates add cost
Low loyalty after a bad fit
Limited adoption of AR and 3D
Problem statement with how-might-we questions, goals and constraints
02 — Understanding the user

Research, audience, personas and the insights that drive the design

Market and competitors

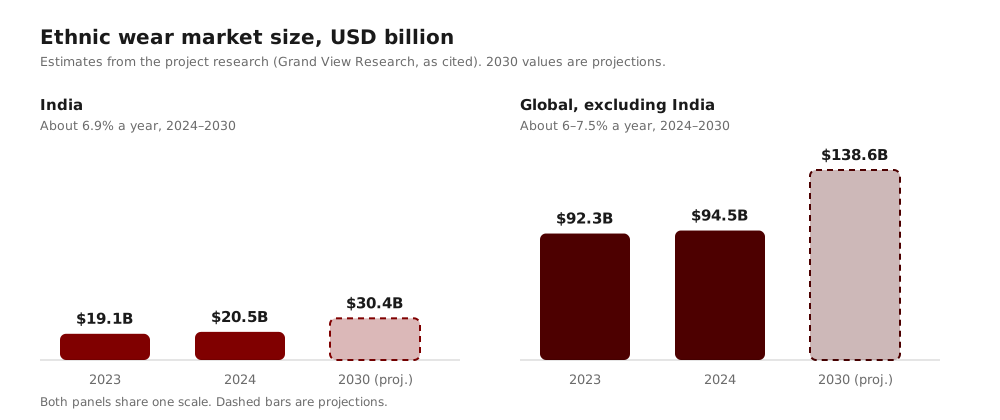
India and global ethnic wear market size, 2023, 2024 and projected 2030

Verification notes Review

The stated growth rates match the endpoints and the India and global figures sum to the stated totals. The figures themselves could not be checked against the publisher from this environment, so confirm them in the original report before publishing. A claim in the source deck that India is 50–75% of the global market contradicts its own numbers (about 17% of the combined 2023 total), so it is left out.

Urban Indians, 30–60

Professionals and business owners buying for weddings and festivals; value convenience and accurate fit.

Millennials and Gen Z, 18–30

Mobile-first shoppers who want trendy and fusion looks, with personalisation.

NRI community

High demand for weddings and festivals; fit is hardest when ordering from abroad; willing to pay for custom fit.

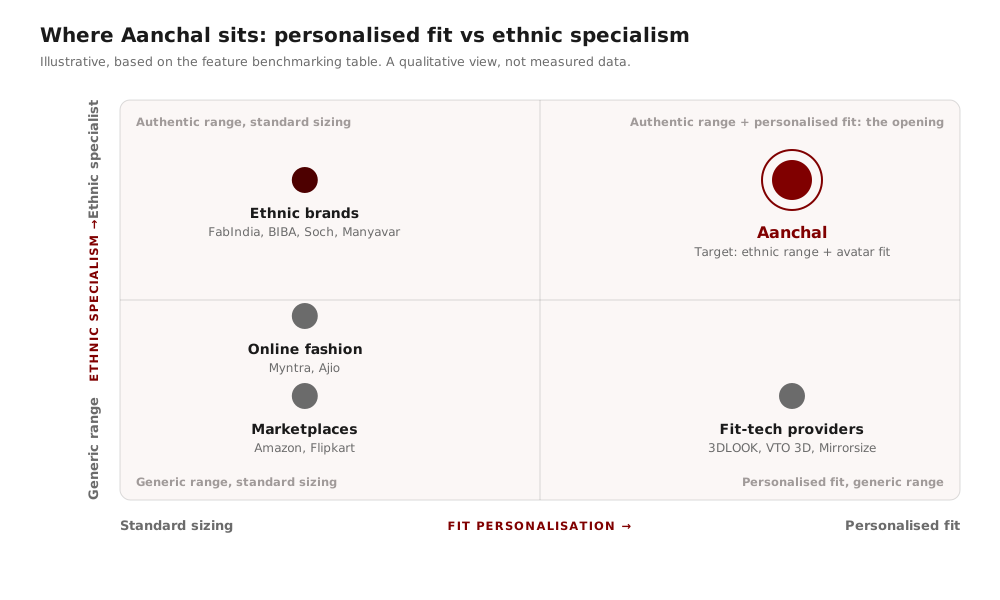
Positioning map of competitors by fit personalisation and ethnic specialism

Illustrative, based on the feature benchmarking table: ethnic specialists have range but standard sizing; fit-tech providers personalise but do not sell ethnic wear. The top-right is open.

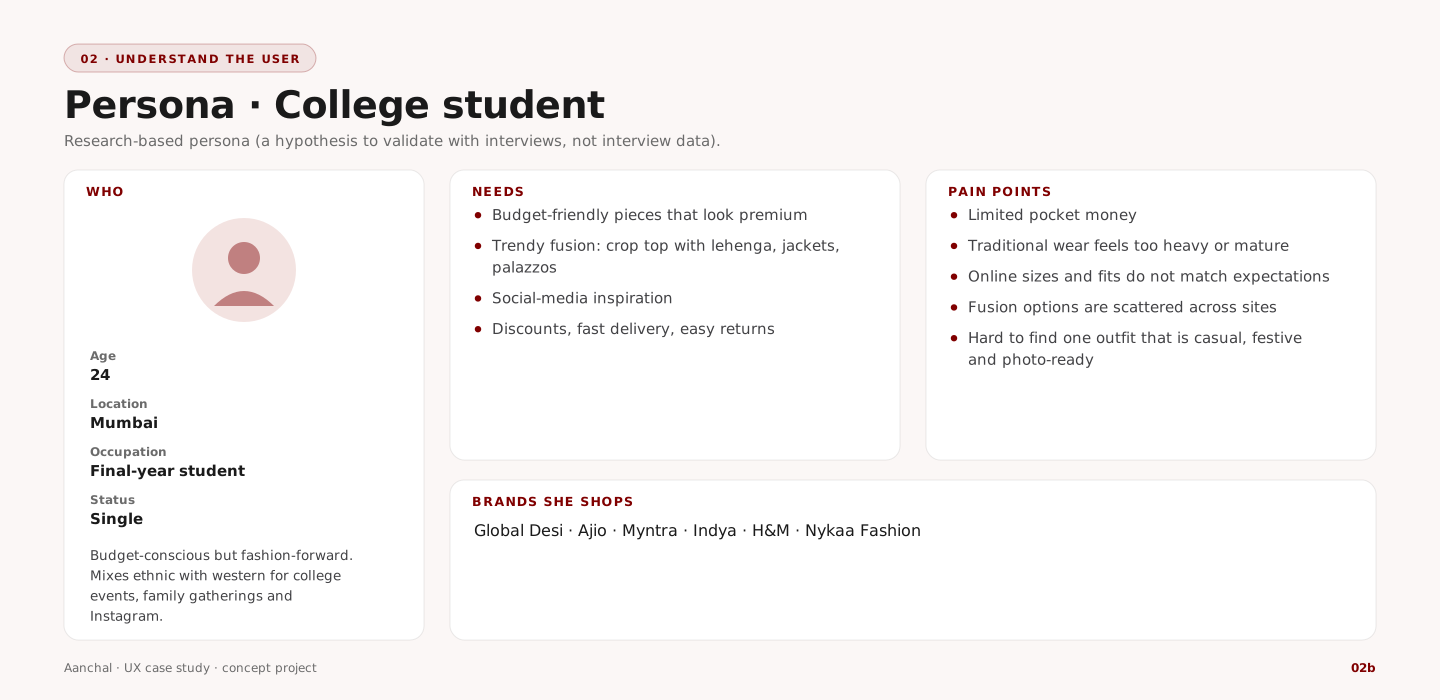
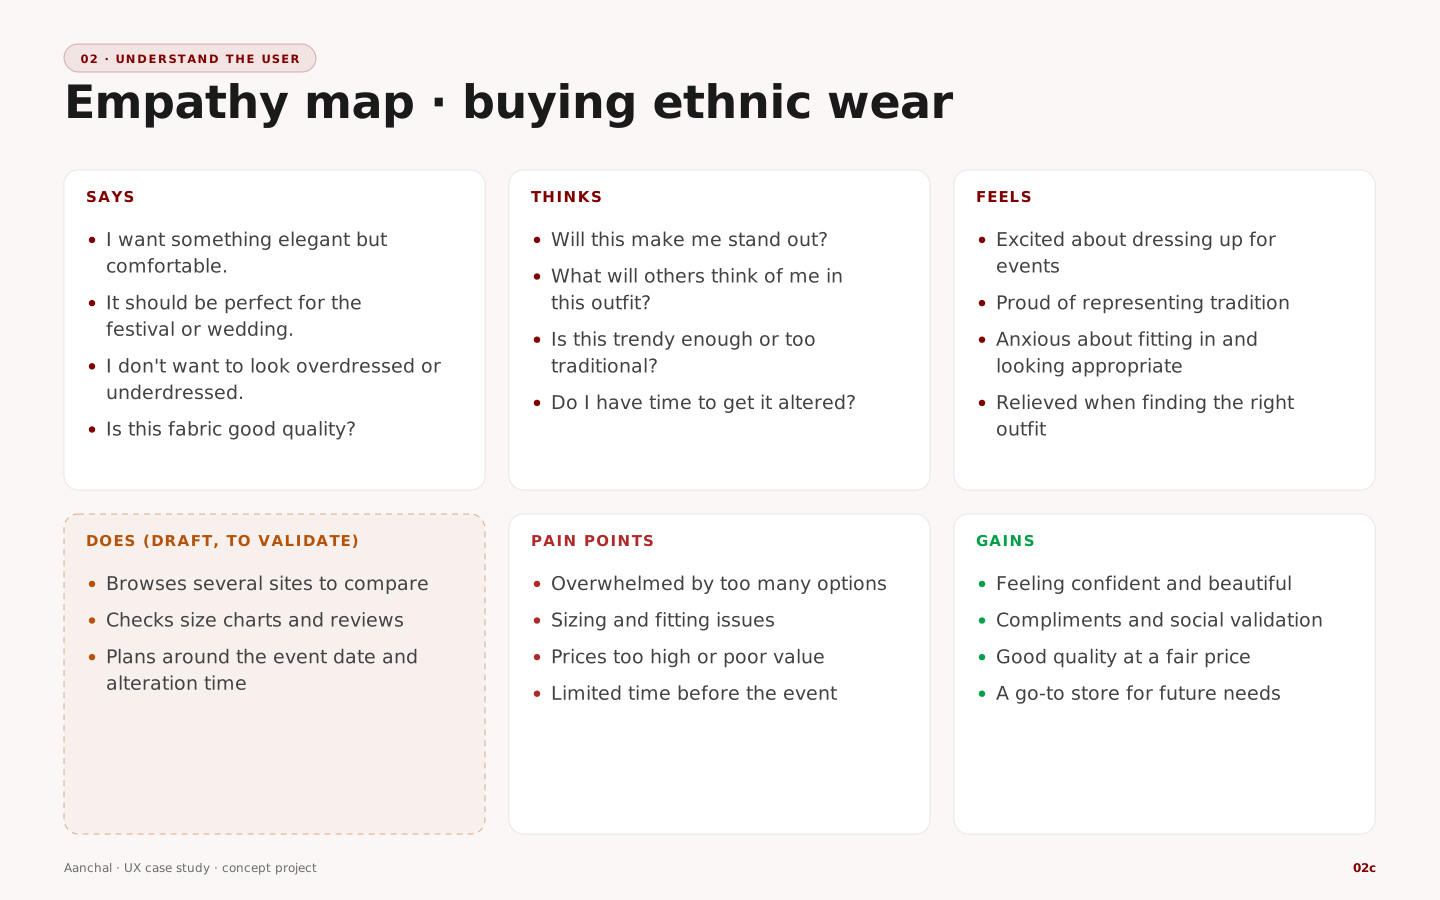
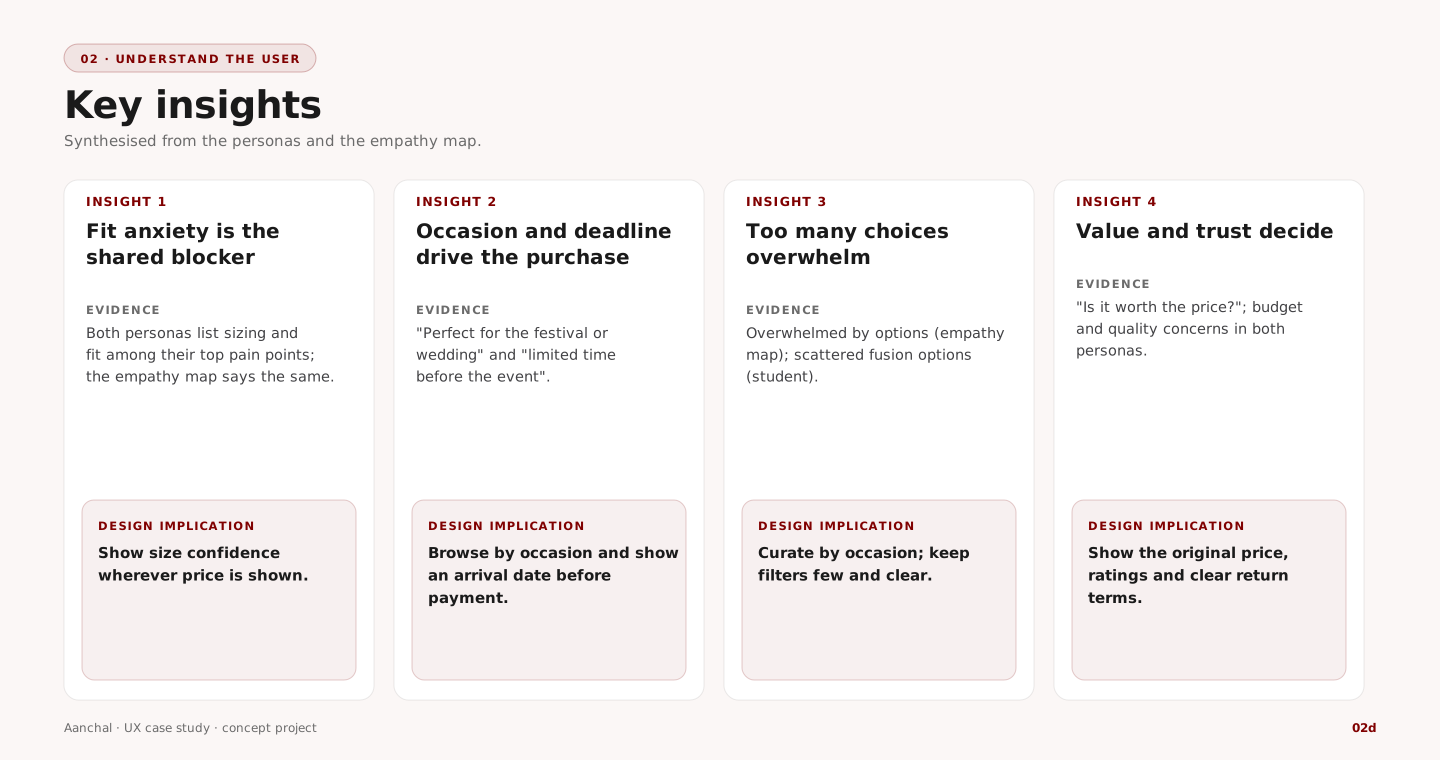
Personas, empathy map and insights

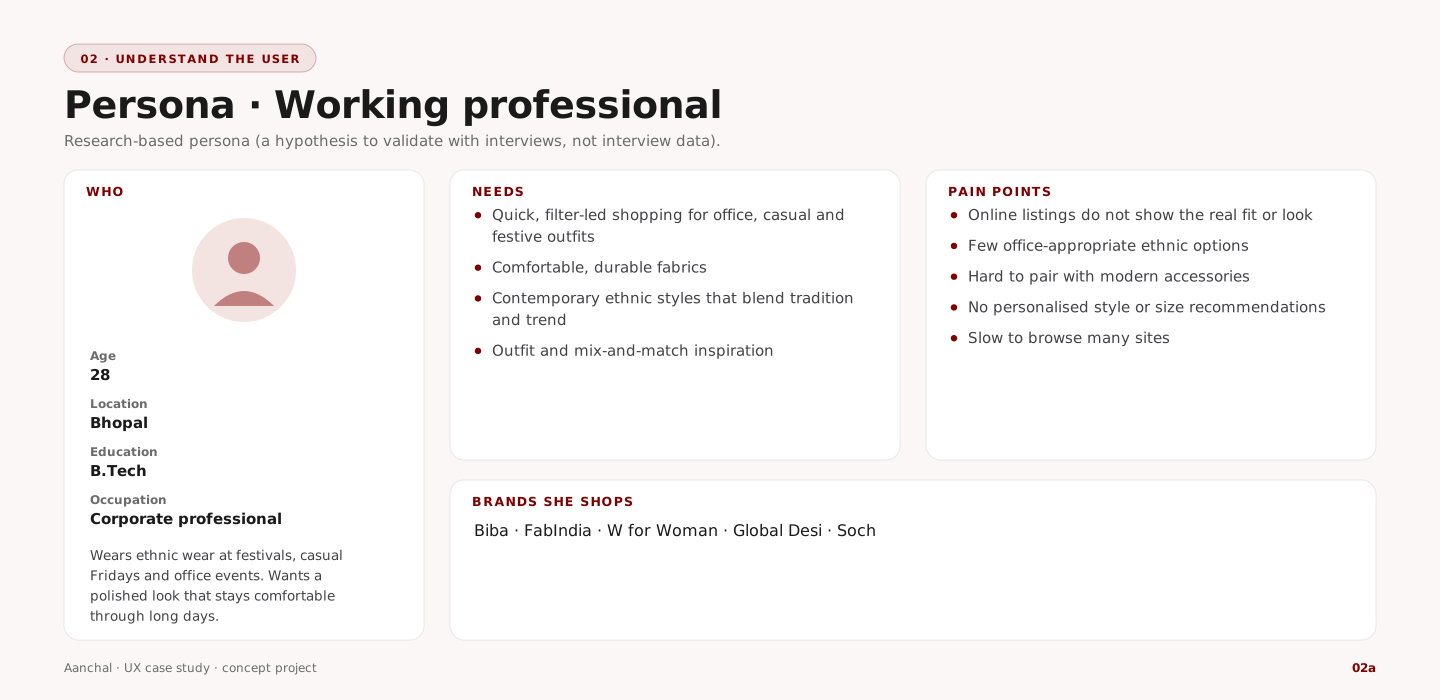
Persona: working professional
Persona: college student
Empathy map: buying ethnic wear
Four key insights with design implications
03 — Information architecture

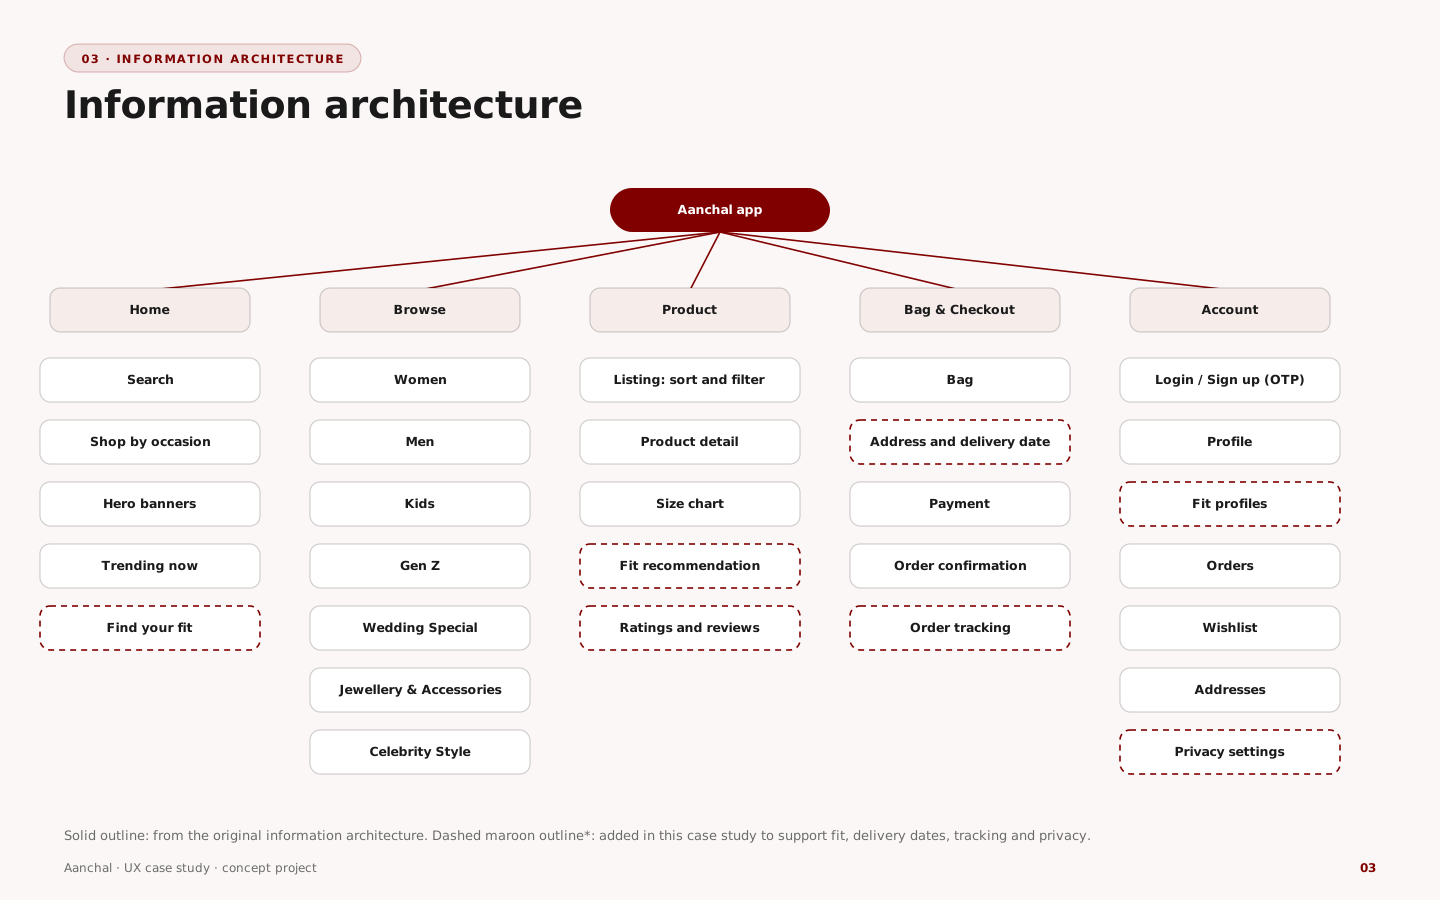
Five areas, with fit, delivery dates and privacy added

The original structure covered home, categories, product and account. Dashed items were added to support the insights: a fit recommendation on the product, a fit-profile area in the account, a delivery date at checkout and order tracking.

Information architecture sitemap
04 — User flow

Sign in late, and never dead-end the fit profile

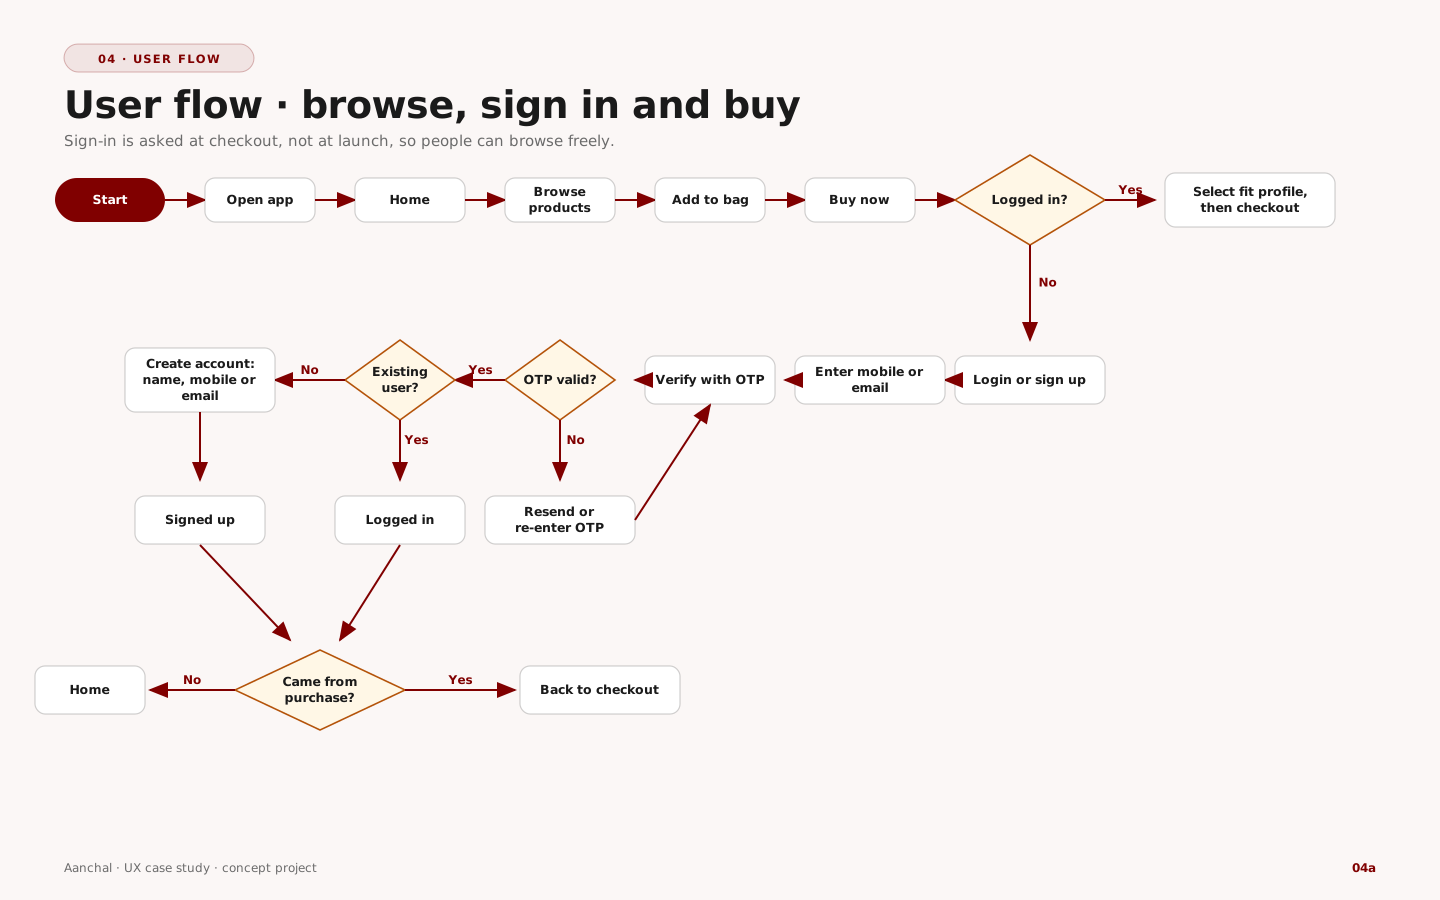
Browse, sign in and buy

Shoppers browse, add to bag and press Buy now before they are asked to sign in. OTP verification handles both new and returning users, and the flow returns them to checkout.

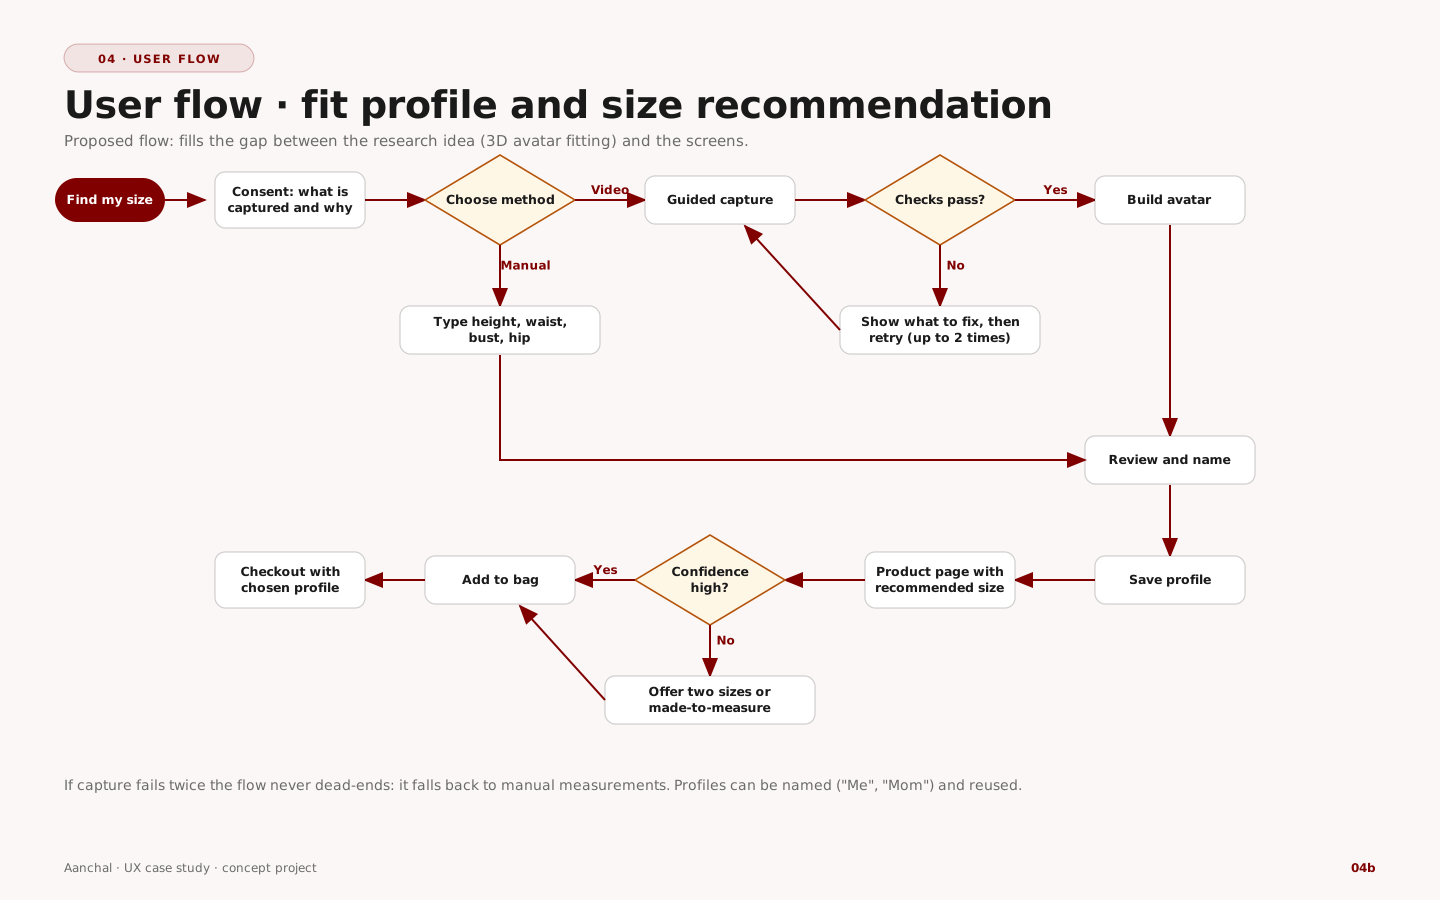
Fit profile

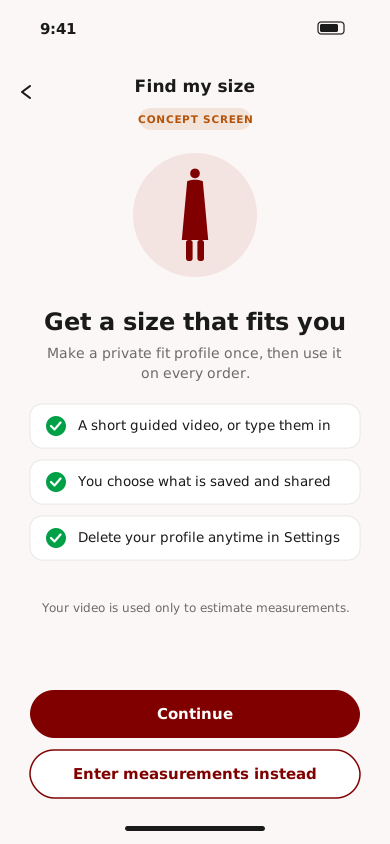
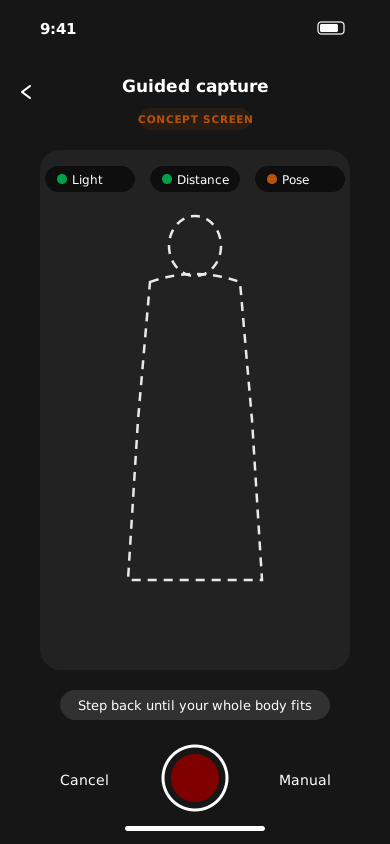
Consent first, then video or manual entry. If capture fails twice it falls back to manual measurements. Low confidence offers two sizes or made-to-measure.

User flow for browsing, signing in and buying
User flow for the fit profile and size recommendation
05 — Wireframes

Structure first: where fit confidence and dates live

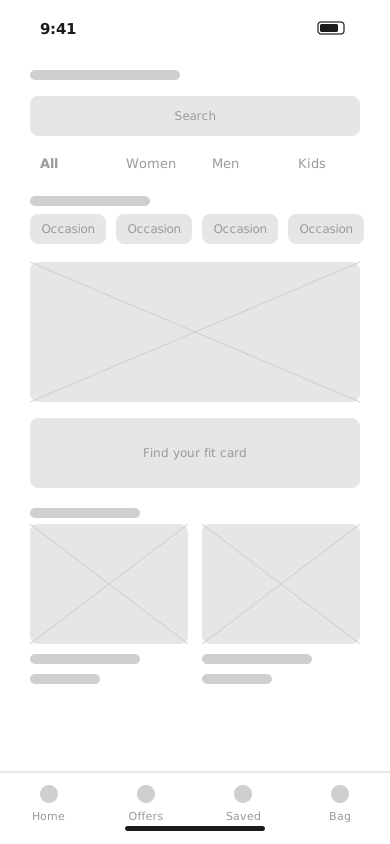
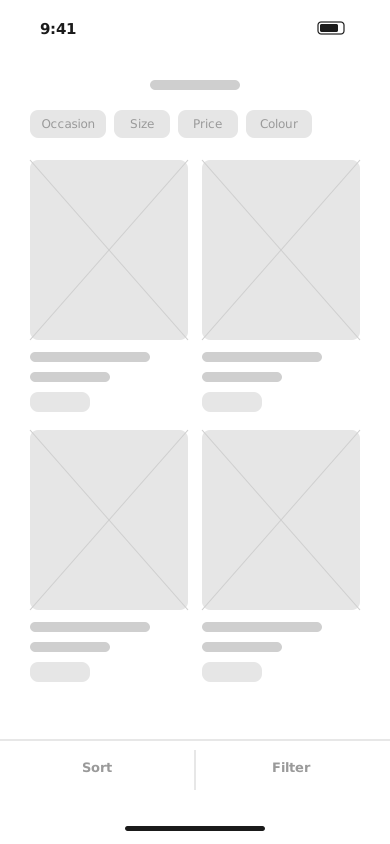
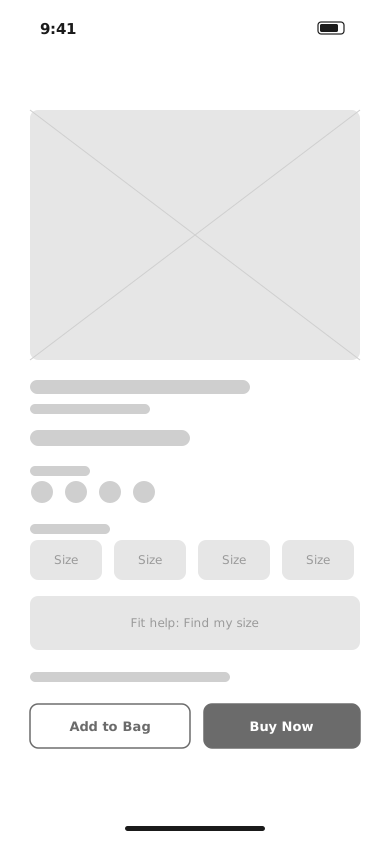
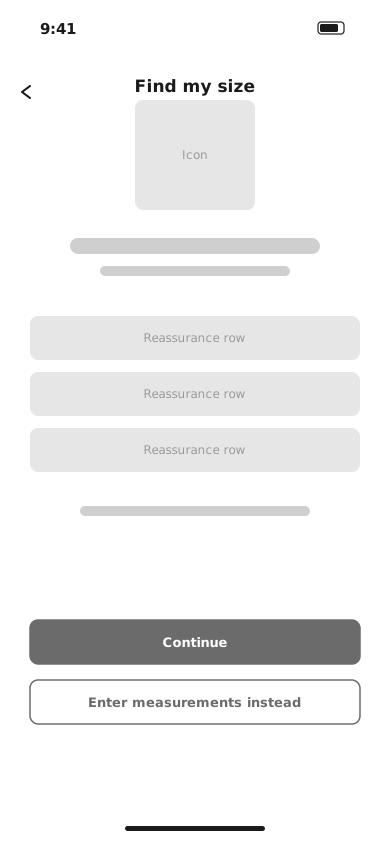
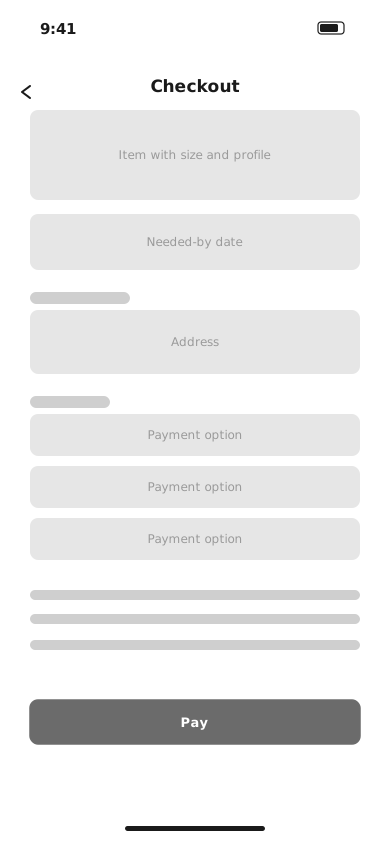
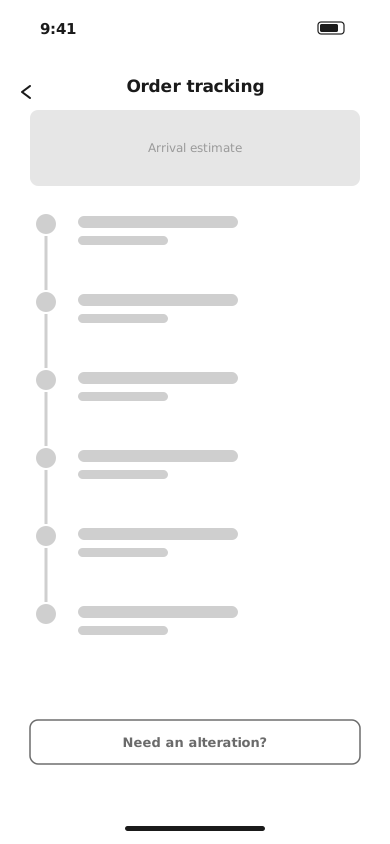
Grayscale wireframes settle hierarchy before colour. Two decisions were made here: a “Find your fit” entry on Home and a fit-help block on the product page, and an arrival date next to the price.

Home wireframe
Listing wireframe
Product detail wireframe
Fit consent wireframe
Checkout wireframe
Order tracking wireframe

Home · Listing · Product detail · Fit consent · Checkout · Order tracking

06 — High-fidelity design

Version 2: maroon, clear prices, and fit built into the product page

These are the v2 screens, designed after an expert review of v1 (see stages 08 and 09). They use original illustrations and sample data.

Entry
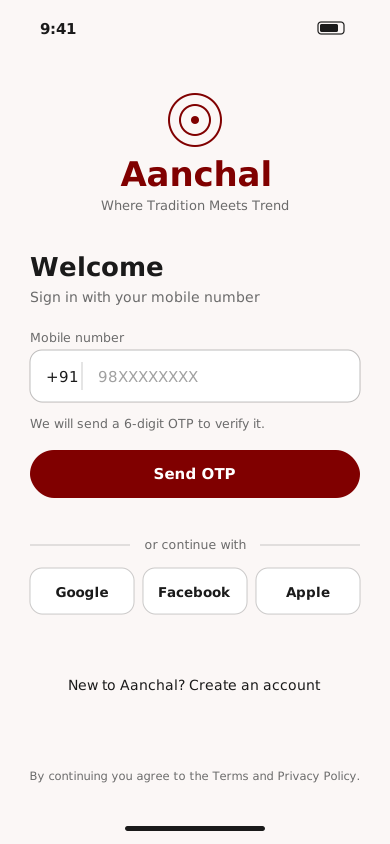
Login screen
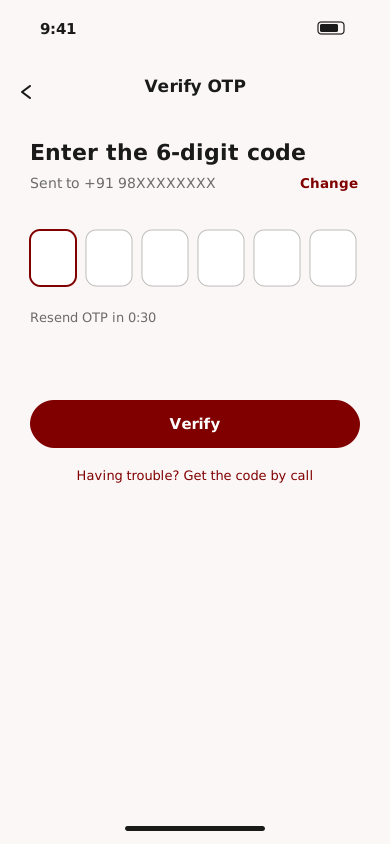
Verify OTP screen
Browse and choose
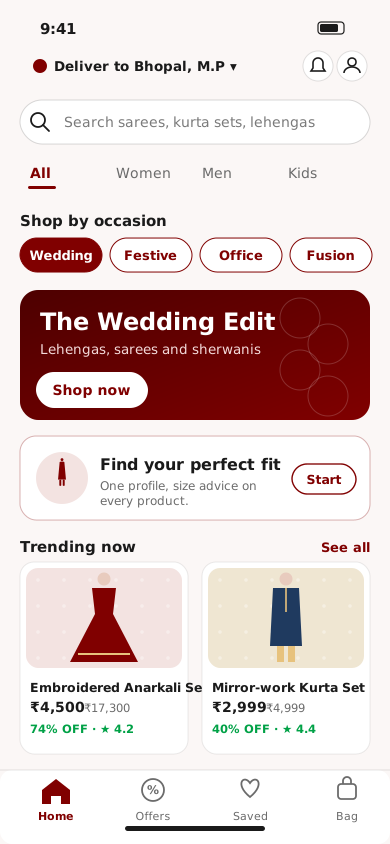
Home screen
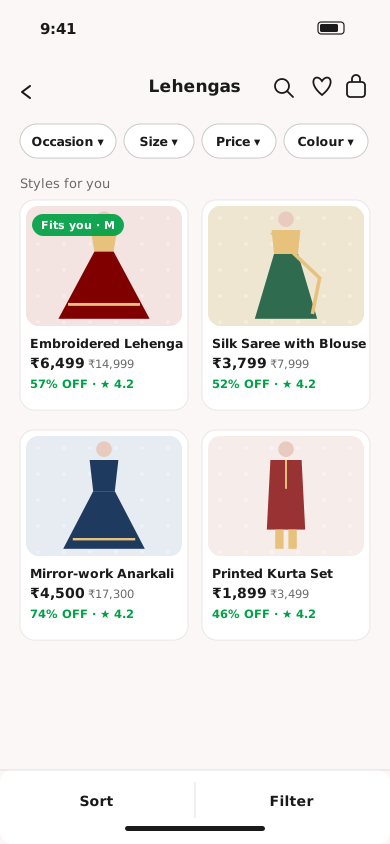
Product listing screen
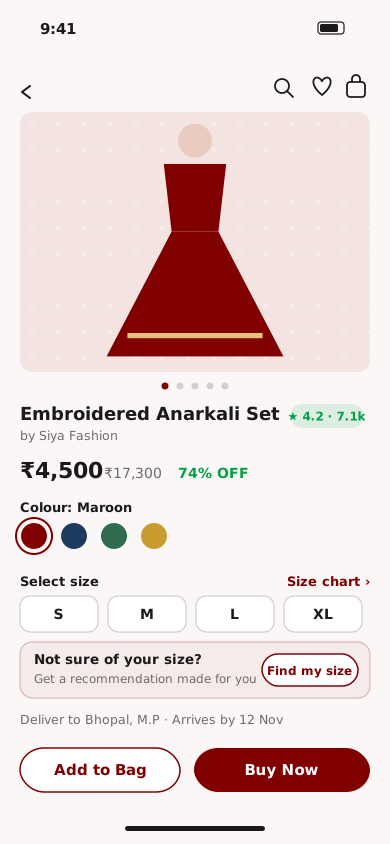
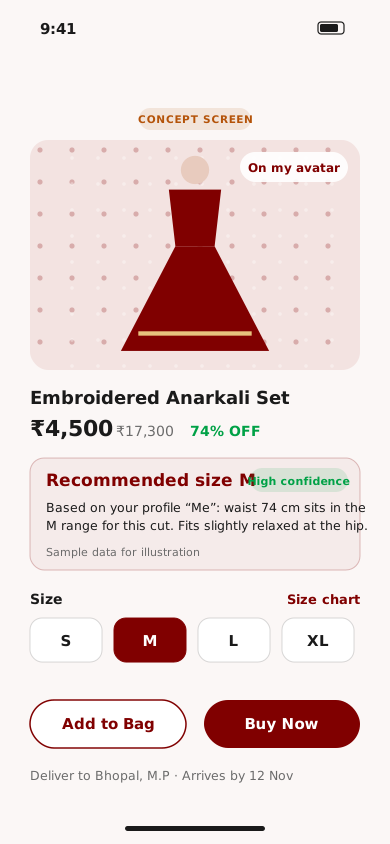
Product detail screen
Fit profile and size recommendation Concept
Fit consent screen
Guided capture screen
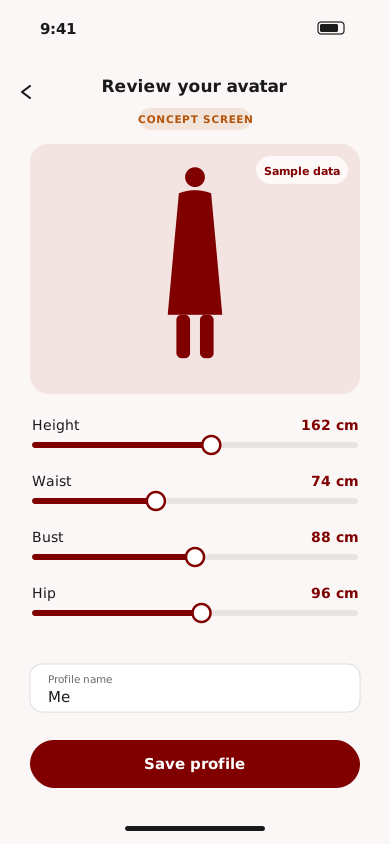
Avatar review screen
Product page with size recommendation
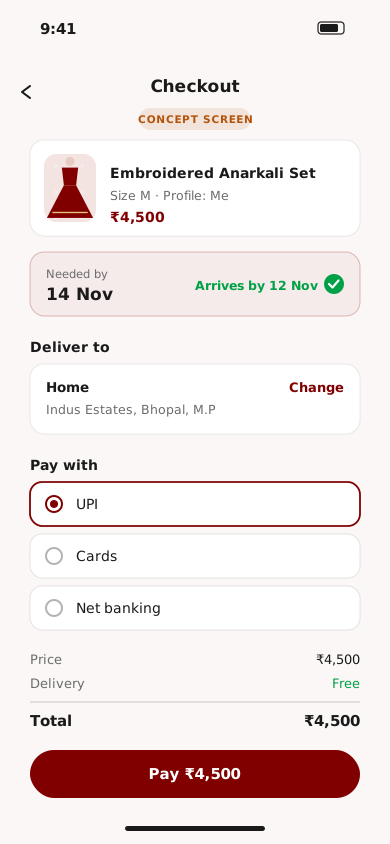
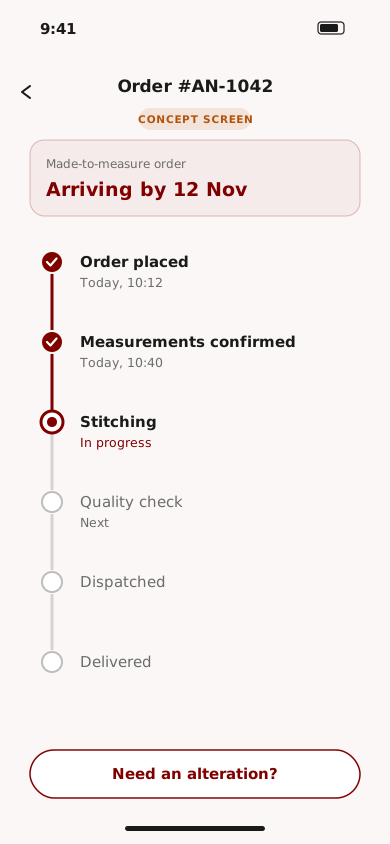
Buy and track Concept
Checkout screen
Order tracking screen

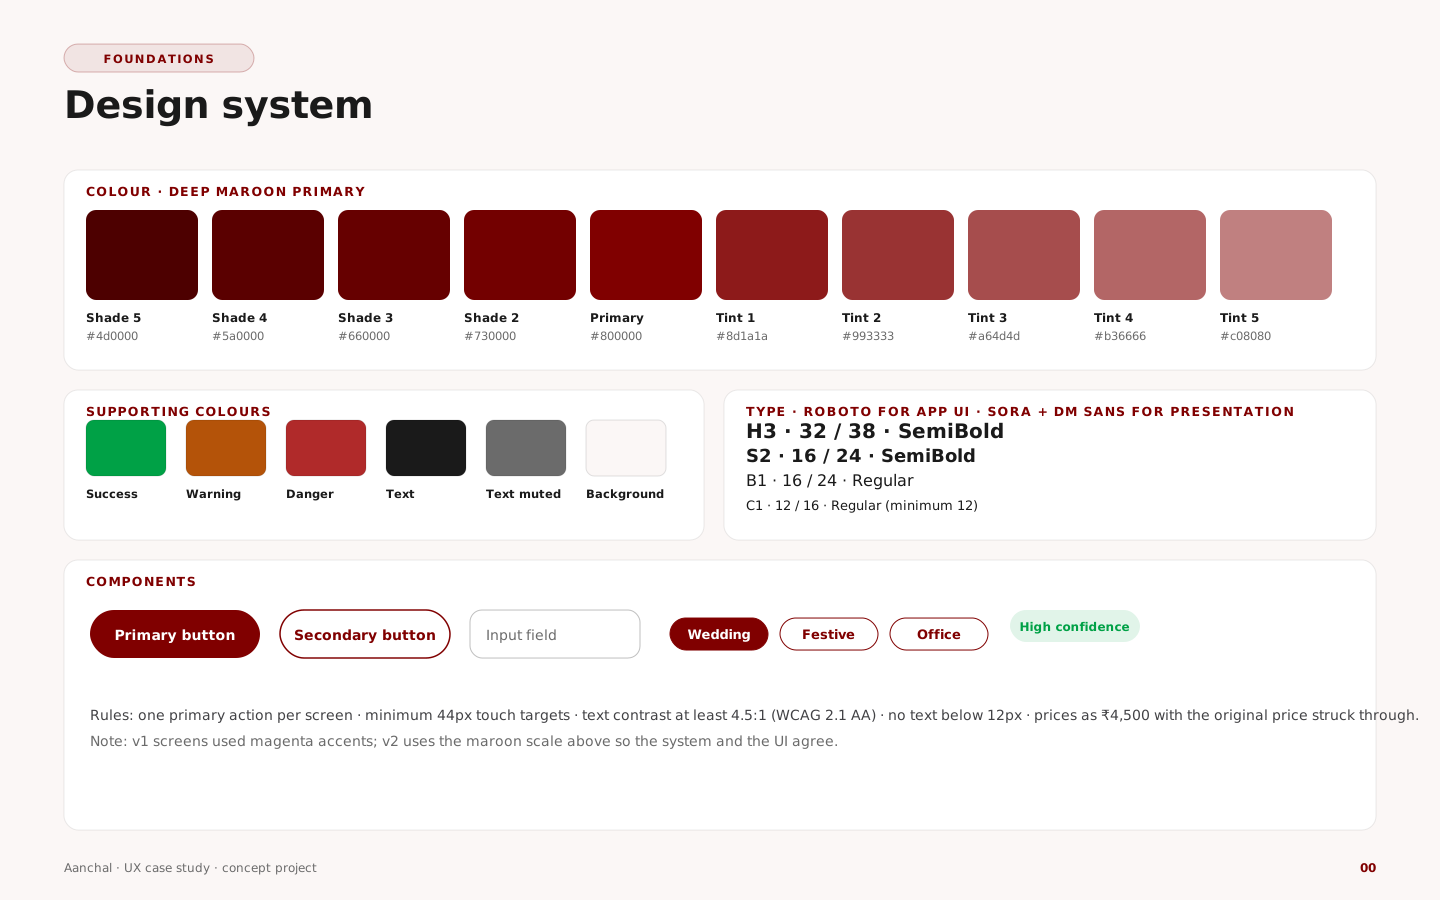
Design system

Design system: colour, type and components
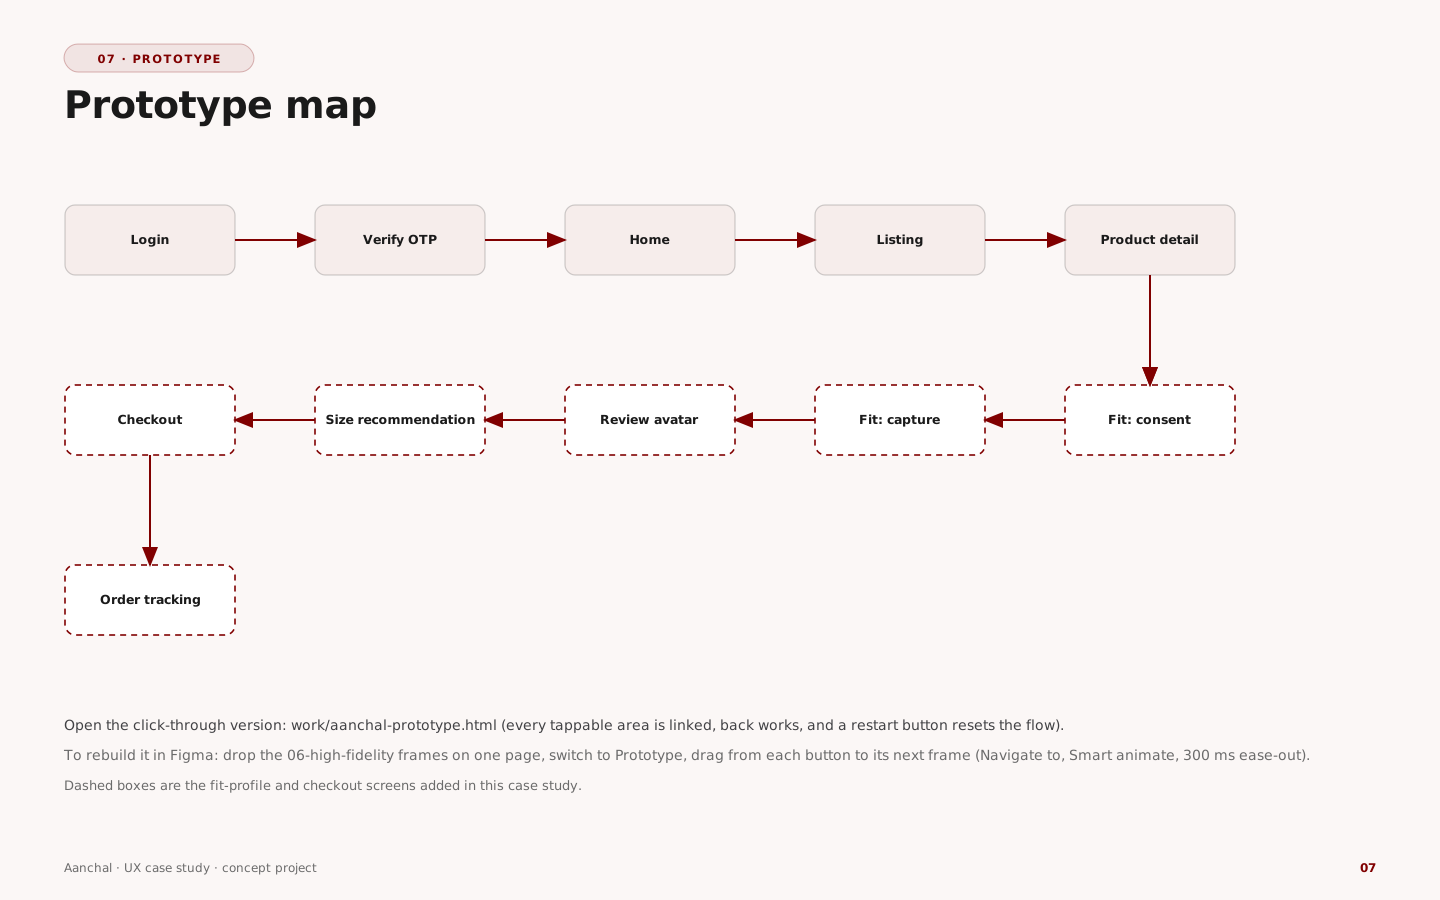
07 — Prototype

Click through the whole flow

Login to order tracking, with every button linked. Use the list on the left to jump to a step. Open it full page.

Prototype screen map
08 — Usability testing

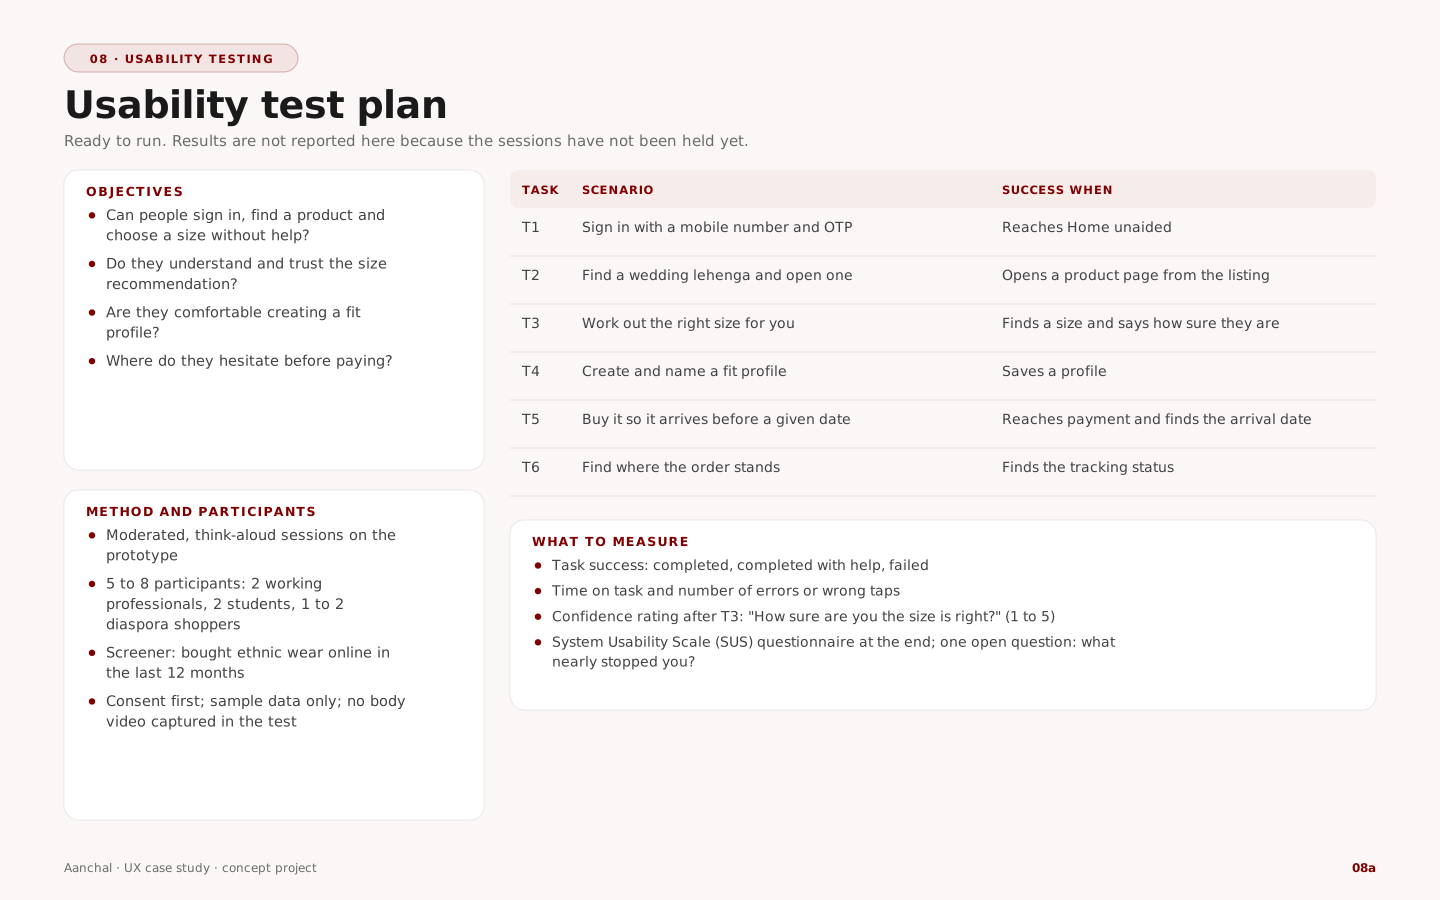
An expert review now, and a test ready to run

Real user sessions have not been held yet, so no user results are reported. What exists: an expert review of the v1 screens against Nielsen's ten usability heuristics, and a complete test kit.

Heuristic evaluation of v1 Expert review

#FindingScreenHeuristicSevChange in v2
1Stock third-party logo on login and sign-up instead of the brandLogin, Sign upH4 Consistency and standards3New Aanchal wordmark and rosette mark
2OTP boxes appear before an OTP is requested; no “Send OTP” actionLoginH1 Visibility of system status3Send OTP, then a verify screen with a resend timer
3Social sign-in is plain text, not tappable buttonsLoginH6 Recognition rather than recall2Tappable Google, Facebook and Apple buttons
4Sign-up asks name, email, mobile and OTP on one screenSign upH8 Minimalist design2Sign-up reuses the OTP screens; name and mobile only, email optional
5Category labels misspelledListingH4 Consistency and standards2Labels corrected; occasion chips replace category thumbnails
6Trending cards show no price or ratingListingH6 Recognition rather than recall3Price, original price, discount and rating on every card
7Title is a seller name; price has no original price shownProduct detailH2 Match with the real world3Product name as title, seller secondary, ₹ price with original struck through
8All colour swatches use the same photo and do not match the colour namesProduct detailH2 Match with the real world3Colour dots with names that match the image
9Size is pre-selected, no selector, no fit guidanceProduct detailH5 Error prevention4No default size; “Select size” prompt and a Find my size banner
10“Add to Bag” is grey and looks disabledProduct detailH1 Visibility of system status2Add to Bag outlined, Buy Now primary
11Magenta accents instead of the documented maroonAllH4 Consistency and standards2Maroon scale used throughout
12Light-grey text on pale backgrounds looks low in contrast (ratio to be measured)Home, ListingAccessibility (WCAG 1.4.3)3Darker text, 12px minimum; measure every ratio in Figma
13No delivery date or pincode check near the buy buttonsProduct detailH1 Visibility of system status2Delivery line with an arrival date above the buttons

Severity 0–4 (4 = usability catastrophe). Findings cover the original v1 login, listing and product screens.

Usability test kit

Usability test plan with tasks and measures
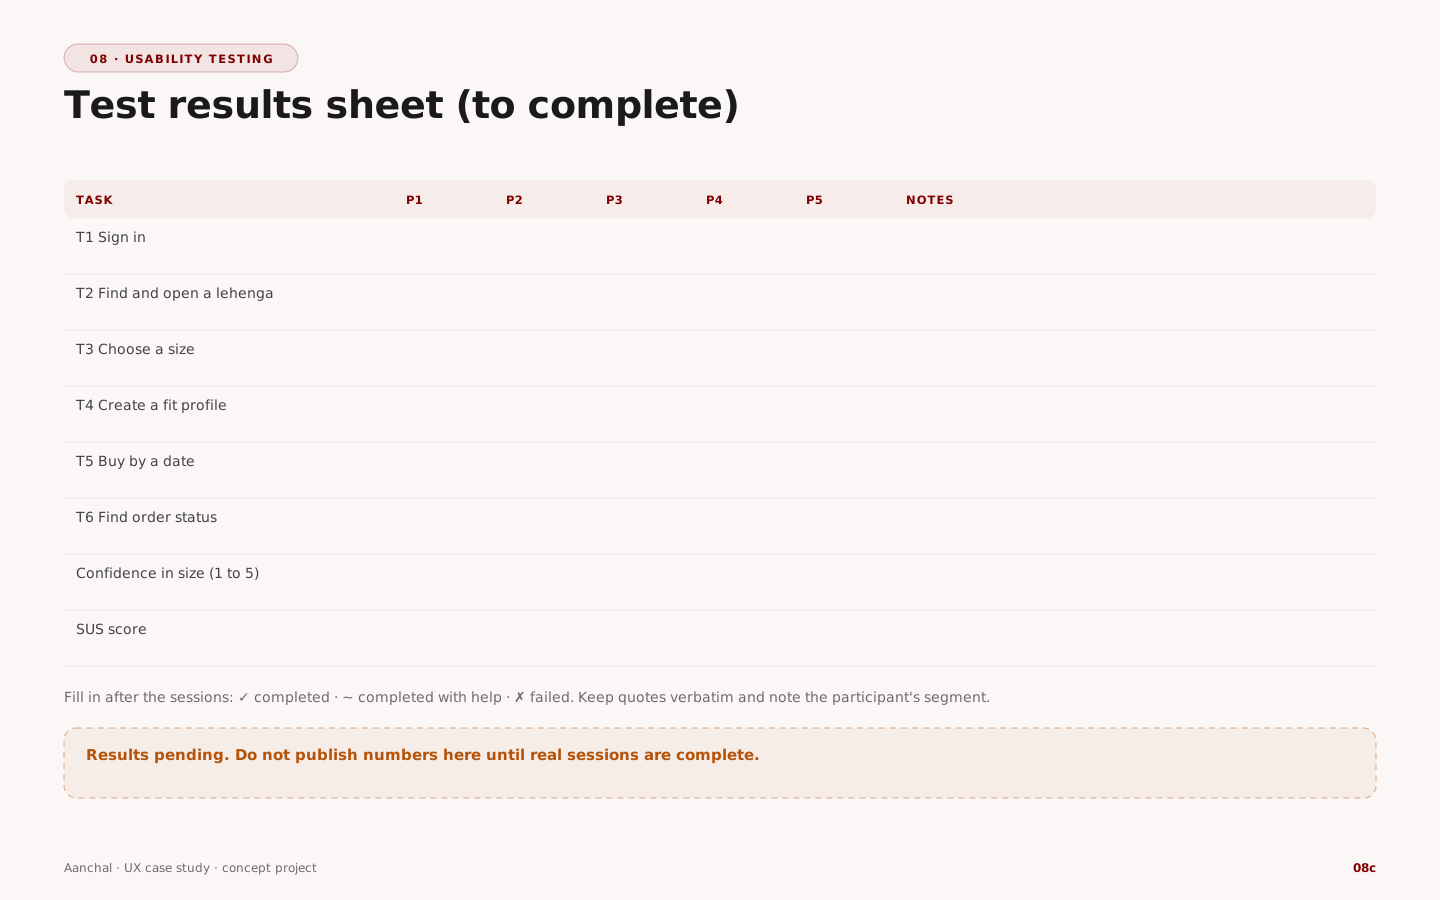
Test results sheet to complete after the sessions
09 — Iteration

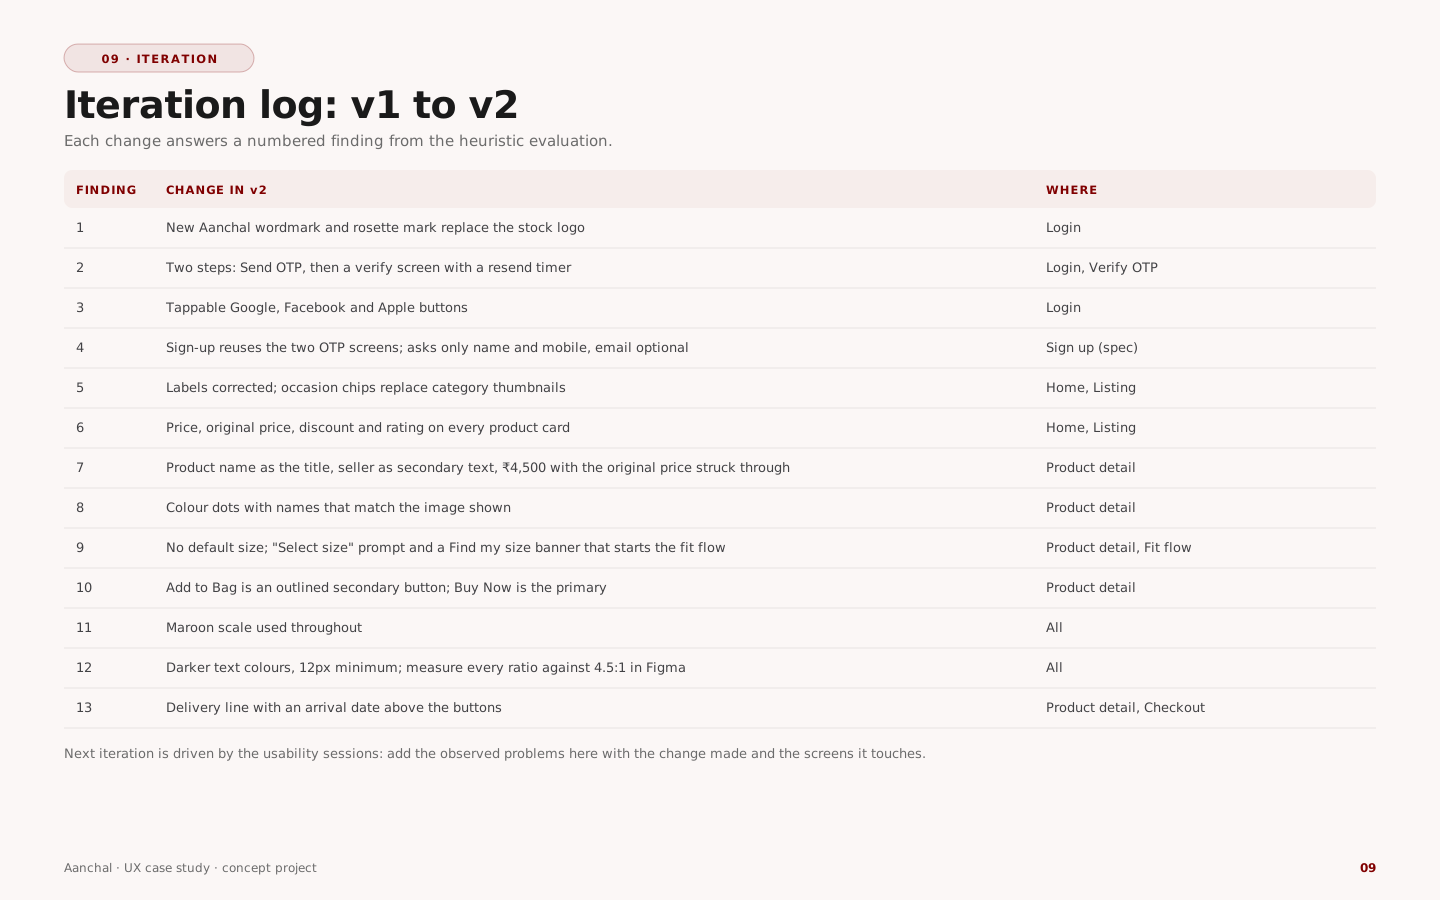
From v1 to v2: every change answers a finding

Trust and brand

Replaced the stock logo with the Aanchal mark; moved every accent to the maroon scale.

Clarity at decision time

Price, original price, discount and rating on every card; real colour options; a delivery date next to the buy buttons.

The core problem

Removed the default size and added Find my size, which leads into the fit profile and a recommendation with a reason.

Iteration log from v1 to v2

The next iteration comes from the usability sessions: record each observed problem, the change and the screens it touches.

10 — Final outcome

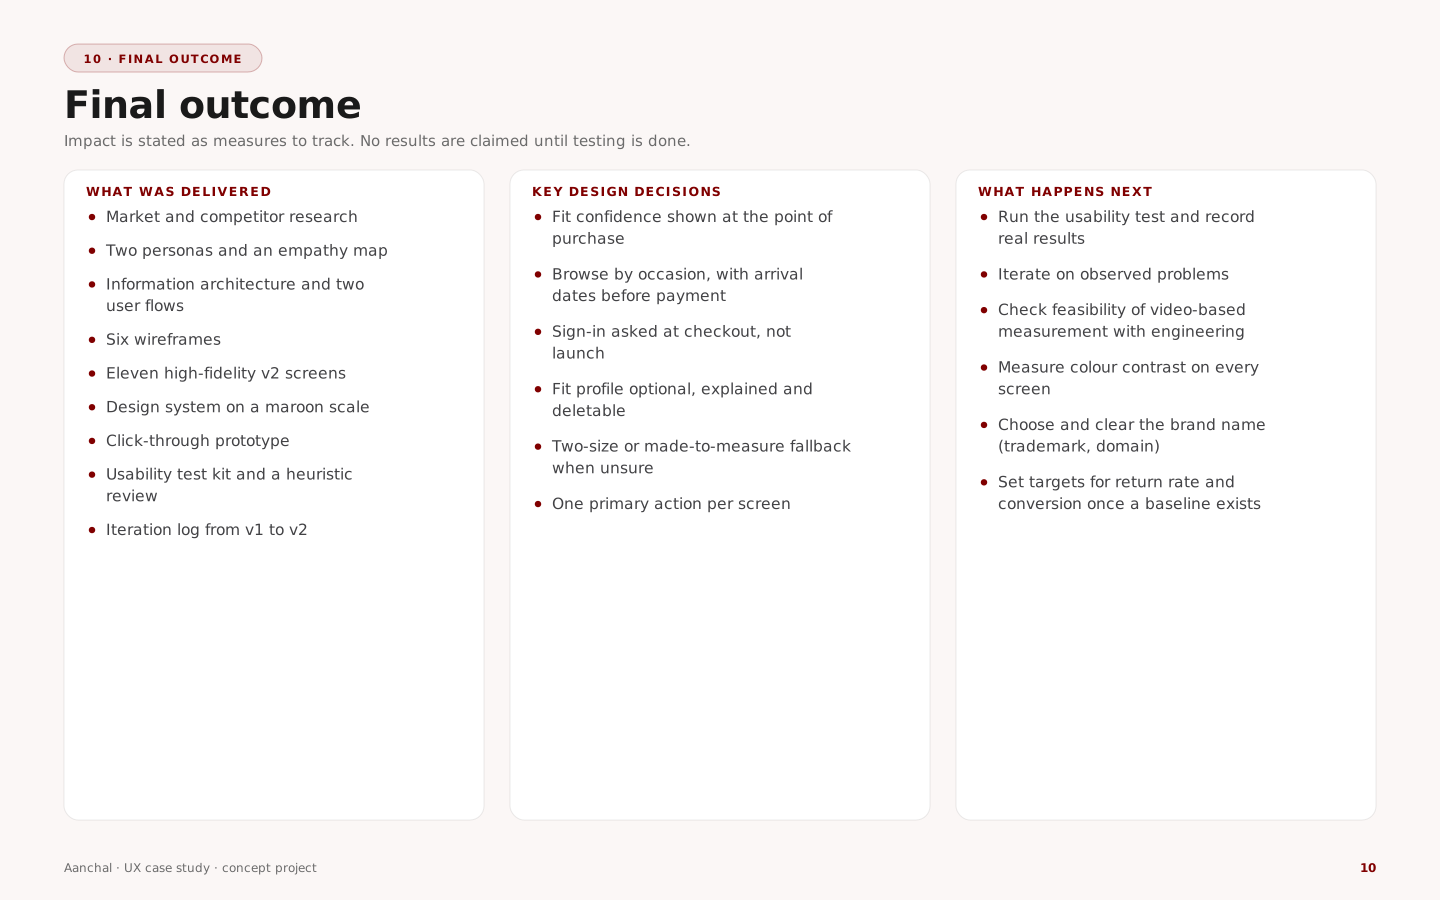
What was delivered, and what to measure next

Delivered

Research, personas, IA and flows
Six wireframes and eleven v2 screens
Design system and clickable prototype
Heuristic review, test kit, iteration log

Key decisions

Fit confidence at the point of purchase
Occasion-first browsing with arrival dates
Late sign-in, optional and deletable fit data
Two-size or made-to-measure fallback

Measure next

Size-related return rate
Fit-profile completion
Try-on to add-to-bag conversion
Task success and SUS from the usability test
Final outcome summary

Open items Next steps

Run the usability sessions and record real results; measure colour contrast on every screen; confirm with engineering that body measurements can be estimated reliably from video; check privacy obligations for body data with legal counsel; clear the brand name (trademark and domain); verify the market figures against the original reports.

References

Sources

  1. Grand View Research — ethnic wear market reports for India and global (market size, 2030 projections, CAGR), as cited in the project research file. Confirm report titles and years before publishing.
  2. Competitor and technology-partner information (FabIndia, BIBA, Soch, Global Desi, W for Woman, Myntra, Ajio, Manyavar, Amazon, Flipkart, 3DLOOK, VTO 3D, Mirrorsize) — desk research from the same file.
  3. Personas and empathy map — research-based hypotheses authored for this project; not interview data.
  4. Nielsen, J. — “10 Usability Heuristics for User Interface Design”, Nielsen Norman Group.
  5. Nielsen Norman Group — “Why You Only Need to Test with 5 Users” (rationale for small qualitative rounds).
  6. W3C — Web Content Accessibility Guidelines 2.1, success criterion 1.4.3 Contrast (Minimum).
  7. Sauro, J. and Lewis, J. — Quantifying the User Experience (System Usability Scale).
  8. Government of India — Digital Personal Data Protection Act, 2023.
  9. Items 4–8 were cited from memory and could not be checked online from this environment; confirm titles and wording before publishing.